landingpageheader2

94.7% FORECAST ACCURACY   ||  BUSINESS-MINDED ECONOMISTS   ||  UNBIASED AND APOLITICAL

Consulting Service Add-ons

Why customize your program?

Your Executive Vantage Point™ (EVP) program is helping you make informed decisions for the main portion of your business (total sales, total units shipped, your largest division, etc.). But this approach can leave out other important segments of your business.

To ensure your business has the right industry foresight, the means to establish an effective pricing strategy, and more, ITR Economics has add-on options for your overall program. We provide additional foresight and insight via these add-ons, giving your executive team every tool they need to plan with confidence.

COMPANY FORECASTING || MARKET FORECASTING || CUSTOM PRICE INDEX || DATACAST SOFTWARE || CHART ADD-ONS


Company Forecasting

Perhaps you are looking to build a strategy around a certain division, but you do not have an accurate forecast for that division. 

As with your EVP program, an ITR Economics Company Forecast provides a 12-quarter outlook for one of your internal datasets, such as Total US Sales. You can add to your EVP program by purchasing an additional Company Forecast, creating an even more robust platform from which to plan.
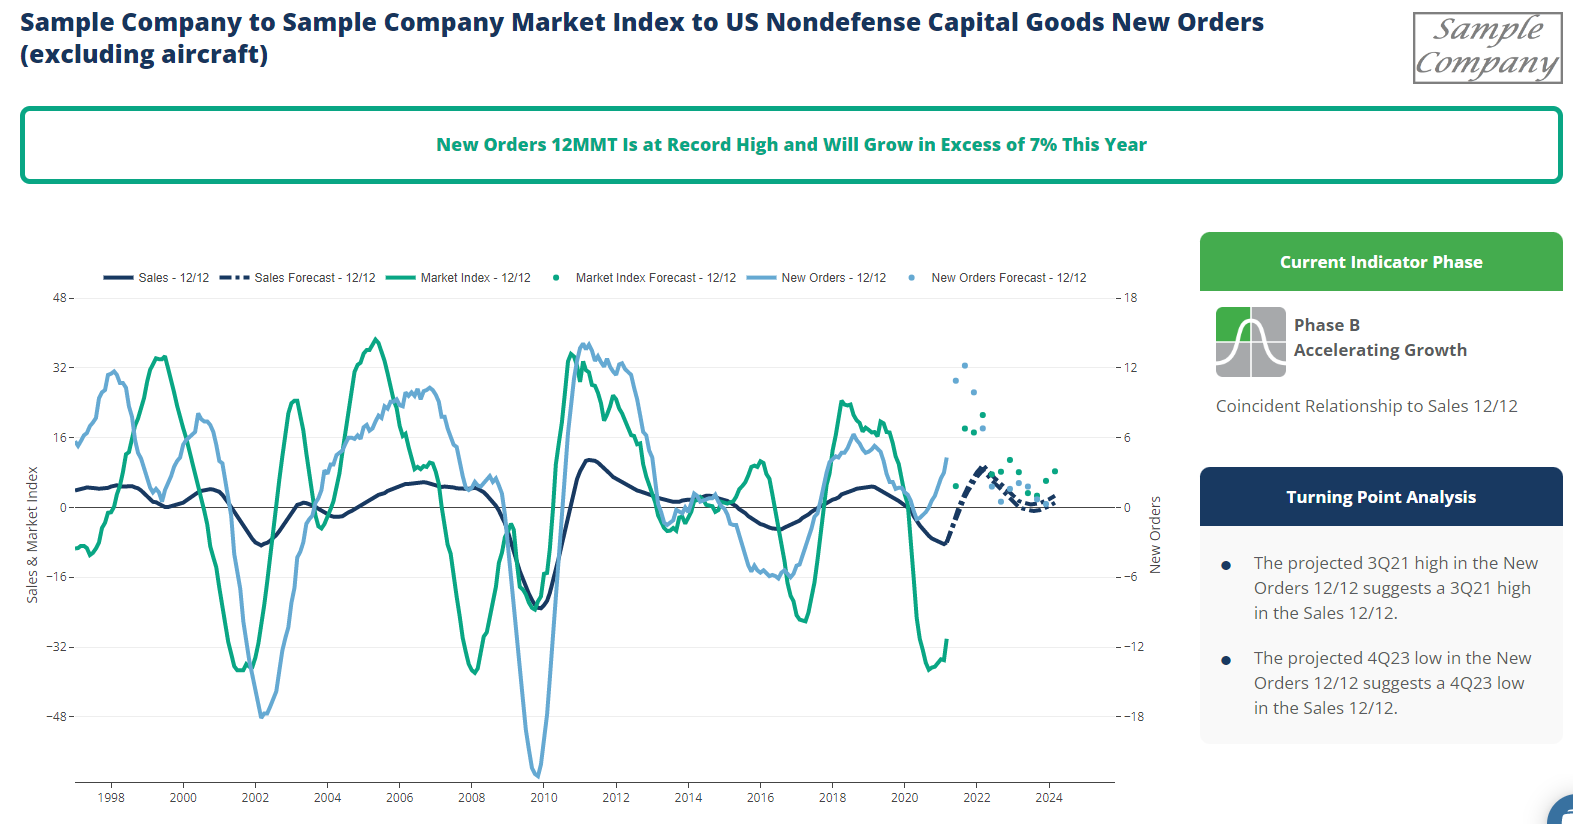
Download Sample

Values Provided

  • See where a subsegment of your business is headed over the next three years.
  • Understand how that subsegment is driving your overall business performance.
  • Allocate resources more precisely and accurately across divisions or product segments.
  • Build focused marketing plans specific to subsegment business activity.

product features

  • 3-year company revenue forecast (12-quarter projection)
  • Macroeconomic update
  • Forecasts delivered as a table and set of charts showing quarterly projections for both the Rate-of-Change and actual dollars or units
  • Management suggestions for maximizing profitability
  • Walkthrough of forecast via our secure onDemand portal
  • Review of forecast with an expert economist for enhanced understanding
  • Quarterly consulting session with our Trusted Advisors
divider_1

Market Forecasting

Have you ever had a consulting session with one of our economists and wanted a more comprehensive view of a specific indicator? Have you and our economist discussed commodities and their impact on your business performance? Do you sell to or from other countries? Will more insight on a foreign exchange rate prove helpful to your strategy? Do you build marketing strategies using foresight into upcoming activity in specific industries?

If your answer for any of the above is “yes,” then consider adding a Market Forecast to your EVP Program.


Values Provided

  • Understand events impacting your business.
  • Effectively inform resource allocation.
  • Plan timely marketing initiatives.
  • Identify areas of opportunity and risk.
  • Access the forecast via the ITR onDemand portal.

Saved Charts


forecast formatting options

Market Forecast

  • Thousands of available datasets to meet your specific needs
  • 12-quarter forecast
  • Includes Rate-of-Change and 12-Month Moving Total/Average charts for visual representation of your forecast
  • Quarterly breakdown of the forecast in table format

Download Sample

Market Index Forecast

  • Understand the future opportunities and risks of your market mix.
  • Gauge the success of internal initiatives against the performance of your total market mix.
  • Use your market mix insights as a proxy for potentially unreliable internal data.

Download Sample

Dashboard

  • Thousands of datasets from which to select
  • 4- to 12-quarter forecast for each dataset selected, depending on data type
  • Color-coded to the Business Cycle Phases for a quick overview across all your forecasts
  • A clear, concise outlook for the busy executive that needs the information but does not have a lot of time

Download Sample

divider_1

Custom Price Index

"As we move through this tumultuous decade, it will become increasingly important for each business to find a producer or material price index that fits their business. Using this will be the difference between profitability and losing money.” – from ITR Economics’ 2014 book, Prosperity in the Age of Decline

As we move through the 2020s and closer to the 2030s, ITR Economics has answered this need by developing our Custom Price Index service, built by our experts and specifically applicable to your business during what will be an inflationary period beyond what this generation of young leaders have so far experienced.

Download Sample


Values Provided

  • Get key insights in time to develop a profitable pricing strategy.
  • Understand how input costs will increase over the next year.
  • Protect your margins with proper pricing strategy.
  • Inform your purchasing and inventory decisions.
  • Gain foresight into process and other input costs for accurate cash planning.

product features

  • 4-quarter forecast
  • Table and charts showing quarterly projections for both the rate-of-change and quarterly average prices
  • Actionable Management Objectives™ specific to your company
  • Supporting text analysis identifying risks, opportunities, and driving factors behind the forecast
  • Web portal access
  • Consultative reviews of the Custom Price Index and forecast with your Trusted Advisor 
divider_1

DataCast™ Software

DataCast is a data analysis tool that puts YOU in the driver’s seat, letting you plot your data against leading indicators found in ITR Economics’ database – in real time. This hands-on experience will increase your understanding of where you have been and where you are going in relation to market trends.

It’s a robust, intuitive, online tool that will give you a greater understanding of the economic trends driving your business and help you identify where your company is headed.


Values Provided

  • Understand events impacting business
  • Increase internal forecasting accuracy
  • Launch well-timed marketing
  • Benchmark internal success

product features

  • Designed for business executives who are not economists
  • Upload company information and generate trend comparisons
  • Create charts based on highly correlated indicators
  • Access indicator forecasts to see how data will trend in the future
  • Invert data/charts to draw inverse comparisons
  • Chart internal data to understand how 3MMT is performing against 12MMT and how different divisions are performing
  • Online access: pull reports autonomously, export any and all charts created, and more
divider_1

Chart Add-ons

The charting options below can help you assess market influence, conduct in-depth divisional analysis, quickly identify sources of upward or downward pressure, and provide visual representation of the impact additional indicators are having on your business. Which chart can help your business today?


1. ADDITIONAL INDICATORS WITH LESS TEXT

Looking for additional insight – more than the standard 5−7 indicator inputs – into the drivers of your forecast? Look no further! We can customize your program to include more leading indicator inputs to support your analytical needs.

chart1-2

2. MARKET/COMPANY LANDSCAPE OVERVIEW

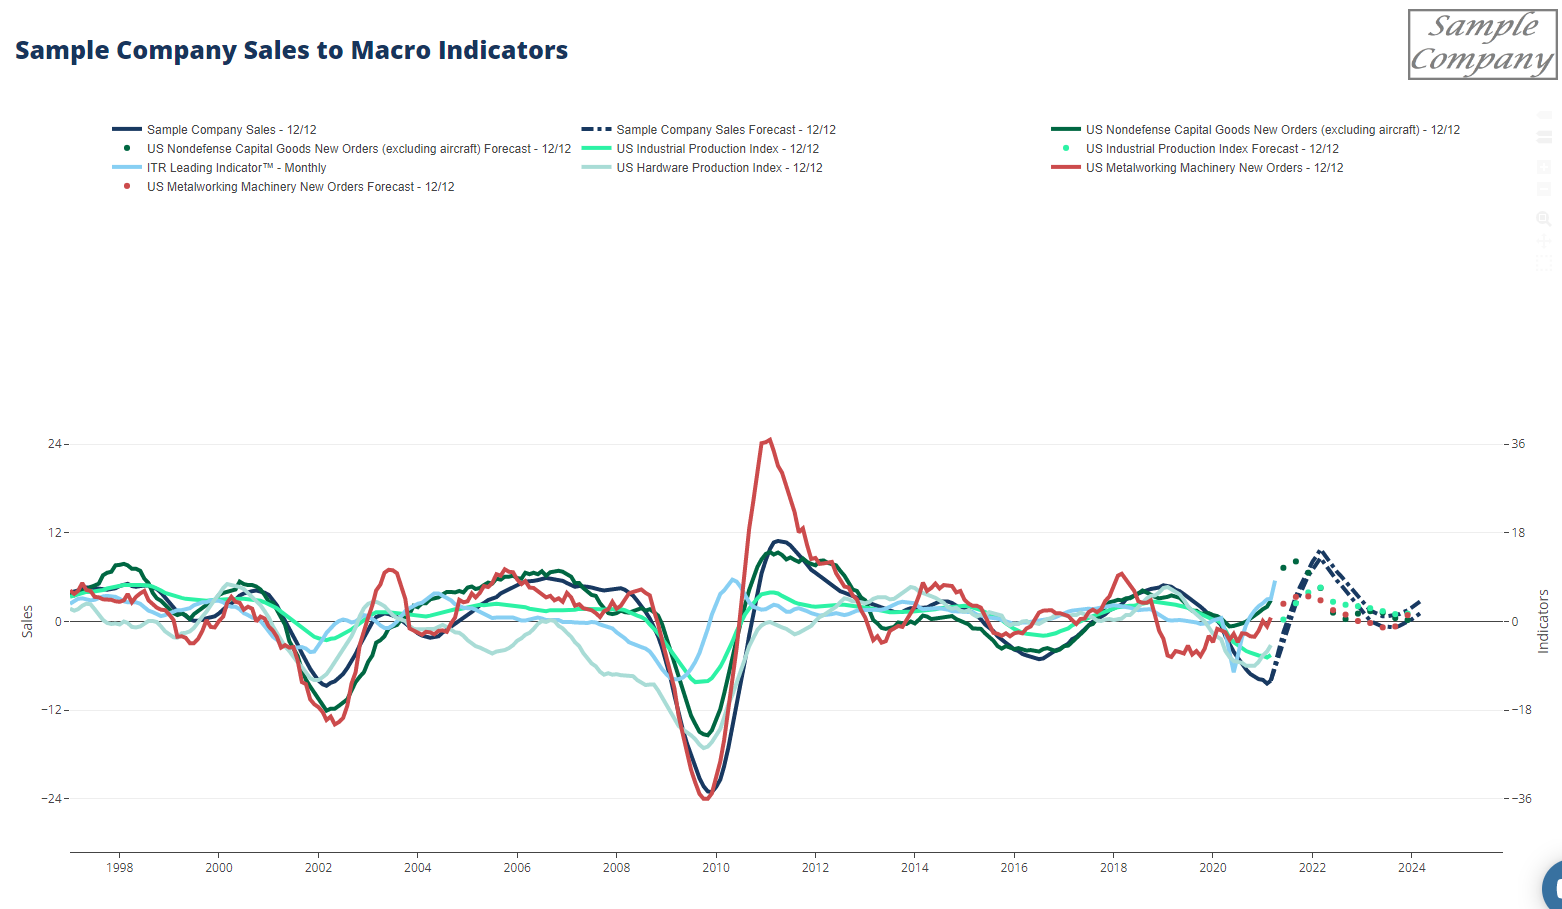
Would a view of your internal company datasets or industries of interest, all overlayed into one Rates-of-Change chart, be helpful for your business planning? Would your team find it useful to see which industries are providing opportunities, and which indicate risks, in one seamless view?

With ITR Economics’ Market/Company Landscape Overview, you can customize your program and begin using this add-on during your consultations with your Trusted Advisor.

chart2-2

3. DIVISIONAL CHART WITH NO TEXT

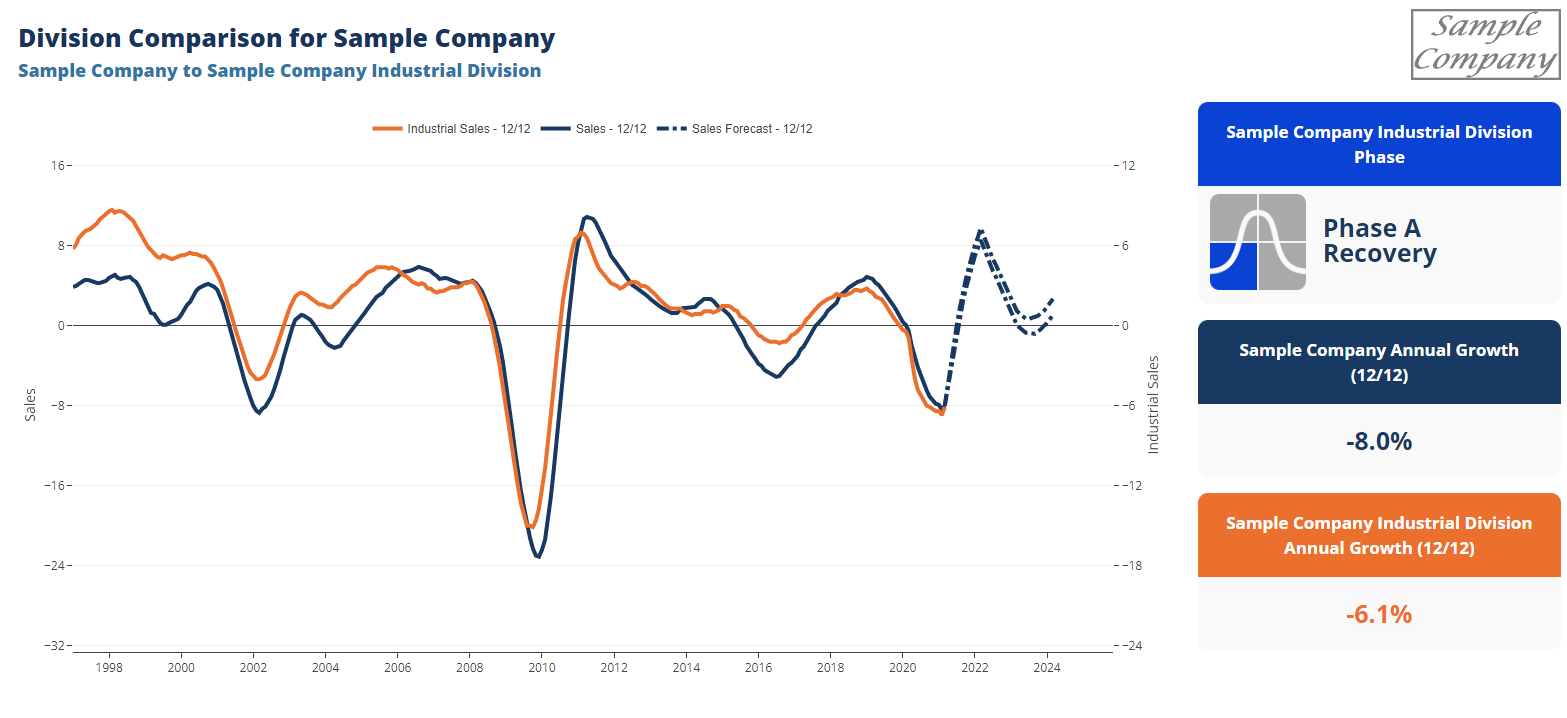
Do you have other internal datasets you want to compare to your main forecasted dataset? Perhaps you have divisions within the business you would like to compare against your Total Revenue?

ITR Economics’ Divisional Charting enables you to customize your program to include the data for these divisions with your report.

chart3-1

4. DIVISION TO INDICATOR

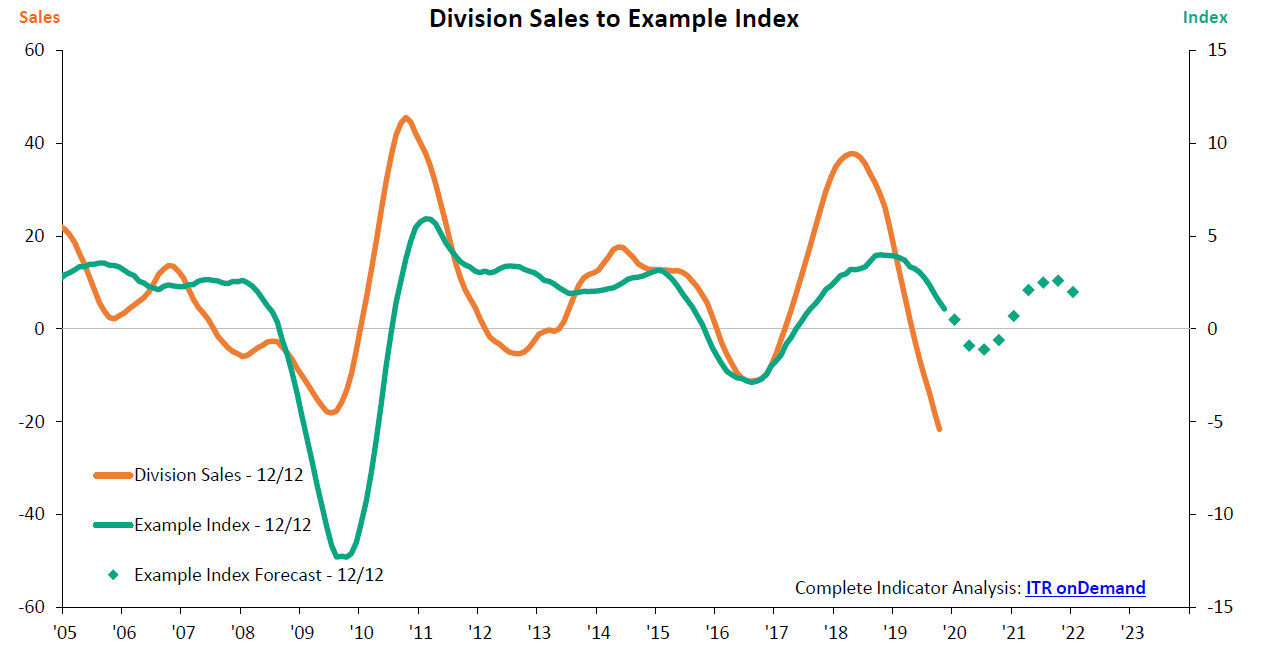
Have you ever asked yourself how a particular indicator may relate to a division within your company, but you do not need an entire program analyzing the division?

With Division to Indicator charting, you get insight into the relationship between a particular indicator and your specific division. Our team will analyze the timing relationship as well as provide the current Business Cycle Phase for this additional dataset.

divisiontoindicator


5. ANALYSIS FOR COMPANY DATASET AND CUSTOM INDEX WITH ONE INDICATOR

Are you taking your program to the next level by including key insights such as a Customized Market Index or Custom Price Index?

If so, then we recommend you consider taking your program even further by getting insight into how these metrics relate to each other.

chart5

ITR-Corporate-Logo-tag-white

77 Sundial Ave. Suite 510W

Manchester, NH 03103

Contact Us

603-796-2500

customercare@itreconomics.com

© 2021 ITR Economics